|
| Box Elder High School Mechanical Physics Home | ||||||||||||
|---|---|---|---|---|---|---|---|---|---|---|---|---|
|
Graphing Basics Introduction- Graphing is one of the most fundamental skills that a science student needs to know how to use. Every experiment we do will have some sort of data that will need to be graphed. The tutorial below as well as the additional notes will help you to learn graphing basics, and to be confident when it comes time to make your own graph.
Work through the tutorial to begin this lesson
Three more graphing rules- One- When the IV is qualitative (not a number), for instance day of the week, we use a bar graph to represent our data. Two- When the IV is quantitative (numbers), for instance time, we use a line graph to represent the data. Here is an example why we use a bar graph for non numerical data. Imagine that you wanted to plot on a graph the number of sales (DV) of cars you had of different colors (IV). The graph may look something like this-
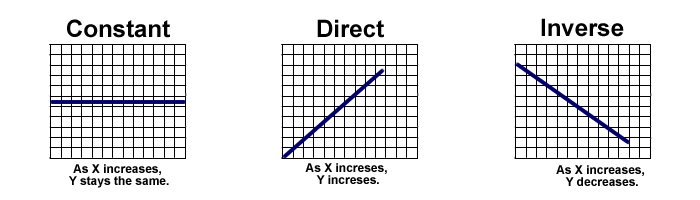
Which one is correct? The bar graph is correct because the IV is non-numerical, it is color. So here is why. If I look at the line graph it shows me that there is data between the different colors. I can look and see some color car between red and gray has some sales, when in reality there is no car between red and gray. Line graphs imply that there is data along all points. Bar graphs indicate that there is only data with the respective x-values, like red, gray, and blue. Three- A graph can indicate many different relationships in the data. The three primary relationships are constant, direct and indirect. You need to be able to recognize these graph when seen and know what they mean.
You will need to turn in the following items.
|